“Derivatives are financial weapons of mass destruction”, is what Warren Buffet said once. While whose weapon it is and against whom this is used is debatable, it certainly has had a torrid impact on the retail traders in India.
A SEBI study reveals that Indian retail traders aggregately lost ₹1.8 lakh crore between FY22 and FY24. Had it found a way to better assets like stocks or even fixed deposits, investors could have been better off.
To check the activity in the futures and options (F&O) segment, SEBI has implemented certain steps in recent months. Whether these measures really curb the speculative spirit among investors is something that must be seen over the coming months.
Amidst all this, Walter White, an investor, who has been predominantly investing in stocks, has a newfound interest in derivatives. While he is not interested in looking at them as a trading product and breaking bad, he wanted to know whether F&O metrics can help him find market trends.
For this, he decides to contact his friend Saul Goodman, who seems to have solutions to every problem. We all have one such friend, don’t we? So, better call Saul.
Walter: Saul, setting aside your usual antics, can you tell me whether F&O data can help us identify trends?
Saul: Warren Buffet, one of the greatest and influential investors, once said, ‘Derivatives are….
Walter: … financial weapons of mass destruction’. I know that! You understand that I’m not going to trade. I’m here to understand how derivatives can help me in identifying market trends and what are the factors that I should look out for.
Saul: Well, I assume that you understand certain basics about derivatives like what an F&O contract is, what is Open Interest (OI), difference between OI and volume etc. Things that can help you in getting some sense on what is happening in the market are India VIX, Option chain, Put Call Ratio and Rollover percentage of futures.
Walter: Ok, what is VIX and how should I read it?
Saul: VIX is the Volatility Index. As the same suggests, it indicates how volatile the market is. Volatility, as you might know, is the statistical measure of an asset’s movement over time. In general, an asset with a wider range of movements is said to be more volatile than the one with comparatively narrow movements.
Walter: I understand. When India VIX goes up, it means the Indian market is witnessing higher volatility.
Saul: Well, yes. But you should know one thing. India VIX is calculated using bid and ask quotes of out-of-the-money options of Nifty 50 index. But yes, this is India’s benchmark index and a good proxy for the broader market. Another point to note is that it is not historical volatility but implied volatility (IV). By that, I mean, it gives an idea about the upcoming movement.
Here’s what usually happens in the background. When participants believe that a larger-than-average move is coming up, the demand for OTM options goes up. Consequently, the premium of OTM options goes up, thus increasing IV. Hence, an increase in India VIX. So, my friend, whenever you see India VIX going up, brace yourself for possibility of a big movement.
Walter: But Saul, I read somewhere that a rising VIX is usually associated with a bear market. Why is that so?
Saul: See, generally, when the market moves up, people are slow to react. However, when the market turns south, the reaction time drops quickly. Participants will want to buy put options soon. When traders get into this bandwagon, that too quickly, the demand for OTM puts goes up and you now know what it will result in – increase in VIX.
Walter: Ah yes! But when I’m bullish there is no urgency, and I’ll think before I leap. Hence, in a bull market, the demand for OTM options may be low and so India VIX will largely remain stable. Right?
Saul: Exactly! Also, it is not always a bear market when VIX goes up. If there are events like elections, people will bet for wild swings in prices, which pushes up India VIX.
Walter: Oh! So that is why India VIX shot up to 31 in June last year, on the announcement of election results?
Saul: There you are! In fact, the index started to rise from 10 in April peaking at 31.70 on June 4, 2024. Here, we cannot associate the rise in VIX with the bear market for obvious reasons.
Walter: So, what’s happening now?
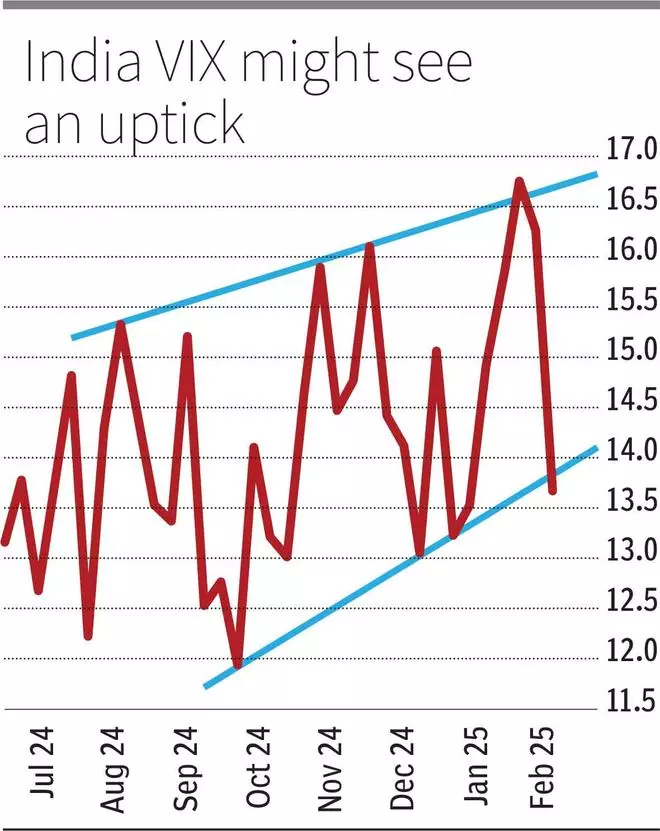
Saul: If you look at the chart, India VIX has been on an upward trajectory since October. After moderating recently, it is now at the bottom of the range. Therefore, there is a chance for it to go up.
Walter: Does that mean another fall is likely?
Saul: It’s a decent possibility, but not a certainty. But you should also know that you should not come to any conclusion based on only one factor. That’s why you should read other indications too. Let me tell you about Put Call Ratio, commonly referred to as PCR.
You could easily guess by its name. When you divide the OI of all put options by OI of all call options, you get PCR. But they should, of course, be of the same underlying and of the same expiry as well.
To understand this better, you should know one thing. Suppose there is one contract of OI outstanding, this means, there is a seller as well as a buyer for this contract. For example, say the 24000-call option of Nifty 50 has 100 contracts of outstanding OI. Here, buyers would want Nifty to surpass 24,000 as soon as possible. Whereas sellers of this contract would just want Nifty to stay below 24,000 until expiry.
As you might be aware, selling of option contracts requires higher margins compared with buyers who will pay only the premium. Here, much is at stake for sellers than buyers. Theoretically in the above example, the potential loss for sellers of option is unlimited, unless they have hedged it.
Generally, the likes of institutional traders and high-net worth individuals are the ones who would sell options. Therefore, it can be better to view the market from their perspective since they are seen as more informed participants. But never assume that they are right all the time.
Anyway, coming back to our 24000-call option example, the sellers do not expect Nifty 50 to rally past 24,000 and so, this is considered as a resistance. By that logic, when the OI of call options are higher compared with put options, the PCR will be less than 1, a bearish indication.

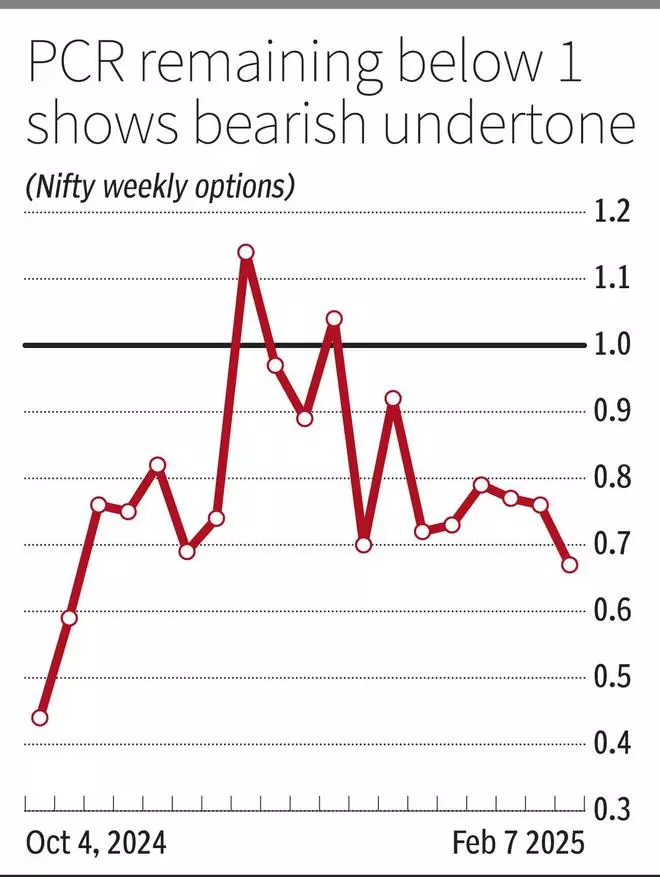
To sum it up, a PCR of less than 1 is bearish and greater than 1 is bullish. However, the ratio has largely remained within 0.5 and 1.5, which can be treated as extremes. This too you have to factor in. So, there are no simple ways to judge, and you will have to make nuanced interpretations which you can by experience.
Walter: This is interesting! Tell me where I can get all this data from.
Saul: Good that you are driving me in the right direction. I was about to talk about what an option chain is, which can be found on the website of exchanges.
Option chain, also called as option matrix, lists all the calls and puts options available to trade on a particular security. This will usually be given based on expiry dates. For instance, the option chain of Nifty February options and Nifty March options will be listed separately. To calculate PCR of February expiry, add OI of all puts and calls, and divide them. That should give you a fair idea of what traders broadly think how the Nifty is going to be until expiry.
Walter: But the option chain seems to have lot many numbers. Is everything important?
Saul: On the face of it, it may look like it has too many numbers. But if you really think about it, you can easily get what you want.
A very good feature of option chains is the segregation of data. Like, one can identify how many OIs are outstanding in each strike price of the underlying, each strike’s IV etc.
While you can check the broader sentiment by calculating PCR, you can get to know the key support and resistance levels too. The strike prices of calls and puts with significant outstanding OI can be seen as resistance and support levels respectively.
On regular tracking, we might sometimes see certain strikes witnessing unusual and sudden spurt in both volume and OI. This can be an indication of an impending wild price movement.
Walter: Great! I calculated the PCR of February and March expiry options of Nifty 50 to be 1.05 and 1.2 respectively. Does that mean the sentiment is positive?
Saul: Broadly yes. But PCR of February is almost near 1. So, we can interpret that both bulls and bears are fighting it out and there are no clear winners yet. But when it comes to March, the number of put options sold is higher than the number of calls sold. This is a positive indication.
Walter: Well, okay. So far, I think we’ve been talking only about the ‘O’ part of the F&O. Do futures have anything to offer?
Saul: Of course, yes! Rollover of futures contracts is something that can be useful. In a way, we can relate it to the momentum of the existing trend.
Walter: But first tell me what you mean by rollover of futures.
Saul: Here we go. Simply put, rollover is carrying a position from one expiry to another. By that I mean, if you are holding a long position on February Nifty futures and assume today is when the contract expires. But you still are bullish and wish you have a long position on Nifty futures. In this case, you will exit February futures long and open a new buy position in the March contract.
Walter: I get it. But I’ll do that only if I have positive outlook, right?

Saul: You hit the right chord. Imagine if most of the traders think alike and rollover the longs from one expiry to another. As you would’ve imagined by now, this will push the future’s price upwards.
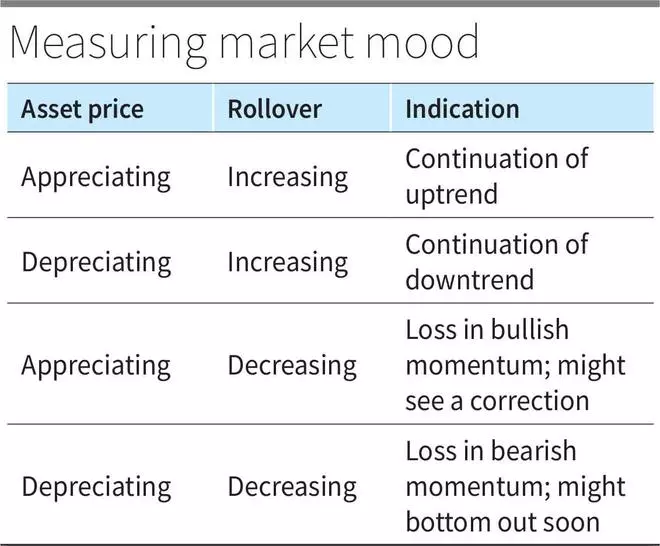
Now comes the important thing – rollover percentage. This number gives you the percentage of long positions that have been carried over from one expiry to another. The higher the number, the stronger the prevailing trend. That is, if the trend is up and rollover is high, it is bullish whereas if the trend is down and rollover is high, it is bearish. Hence, weightage is given to the existing trend. But if rollover percentage drops, it can be an indication that there is a loss in conviction of the existing trend continuing.
For example, the rollover percentage of over 80 per cent can be considered strong for Nifty. So, if Nifty futures continue to go up and rollover remains above 80 per cent, the probability of the rally to continue remains high from the perspective of derivative traders. But if rollover drops even as Nifty futures go up, it can be an indication that the uptrend is losing strength as traders are not interested to carry their longs further.
For example, take the period between March and June 2022 when Nifty corrected by 16 per cent (from March high to June low). In this period, Nifty was on a decline. But the rollover per cent dropped from 82 per cent to 75 per cent during this period. In July 2022, Nifty started to rally. Refer table to get a whole idea.
Spotting the trend
Walter spent some time mulling over his new learnings and then decided to back test it. He went through all the above indicators during the deep correction between March and June of 2022, and this is what he observed.
Although Nifty 50 declined, India VIX dropped during this period, indicating that downtrend is not strong. Also, as Saul had mentioned, the rollover per cent of Nifty futures, too, dipped. These factors pointed a potential bullish reversal in trend.
Now confident with his back test, Walter shared his interpretation of current signals from the F&O market with Saul.
Walter: India VIX has dropped recently but its chart shows that it may have reached the bottom of a rising channel and could rise from here. The rollover per cent has increased from December to January when there has been a fall. These are bearish signals.

Coming to the options chain, it shows that 24000-call and 24500-call have the highest OI, whereas among puts, 23,500 and 23,000 strikes have significant OI outstanding. So, broadly, the bear trend is still valid, and my cash portfolio might see further loss in value?
Saul: Maybe, yes. And apart from looking at these F&O metrics, if you conduct chart analysis too, you can refine your findings further. For example, the price action also shows that 24,000 is a strong resistance. So, probably only a breakout of this can really bring back the uptrend.
You should also understand that these factors might not fall in the same line and could give you mixed signals. During such times, you just stay put and not act.


