Economic Overview
 Economic data in March took a back seat to the fireworks surrounding the meltdowns of Silicon Valley Bank and Signature Bank. The debate over “hard/soft/no landing” pivoted during the month from “no” to “soft”, given the sudden banking crisis here in the U.S., and globally with the shotgun marriage of Credit Suisse to UBS. The economic data, however, continued to remain fairly robust, anchored again by a strong labor market, and steady if not somewhat sticky inflation.
The Unemployment Rate for February came in a bit higher than anticipated at +3.6% (versus expectations for +3.4%), as nonfarm payrolls edged up +311k, versus the prior month’s gain of +504k. Average Hourly Earnings ticked up +0.2% MoM (+4.6% YoY), while the Labor Force Participation Rate came in at 62.5%. The January JOLTS Job Openings report came in at 10.8 million, down from the prior month reading of 11.2 million, though still very robust.
Inflationary pressures remain, however they don’t appear to be worsening at this point. February CPI showed a +0.4% MoM rise (down from January’s +0.5% surge), which translates to a 6.0% YoY rise in prices, largely meeting analyst expectations. Most of the increase for the month was attributed to Shelter, with Food price rises a close second. Energy prices fell -0.6% MoM as oil and natural gas prices declined. Core CPI rose +0.5% MoM and +5.5% YoY.
Producer prices fell -0.1% MoM in February with demand for machinery and wholesale vehicles softening. YoY, PPI rose +4.6% (below expectations of a +5.4% gain), while ex-Food and Energy, wholesale prices were flat on the month and up +4.4% YoY.
Despite surging volatility in March associated with the SVB collapse, the Federal Reserve hiked short-term interest rates by 25 basis points at its March 22nd meeting, citing the ongoing battle with inflation as its main focus. Chair Powell and fellow FOMC members continue to muddy the waters with regard to future rate policy, making hawkish comments one day and then sounding more dovish the next. The May 3rd meeting will be important in terms of setting the tone for the balance of the year, with any signs of an end to the current rate hiking cycle likely being met with bullish enthusiasm.
[wce_code id=192]

Domestic Equity
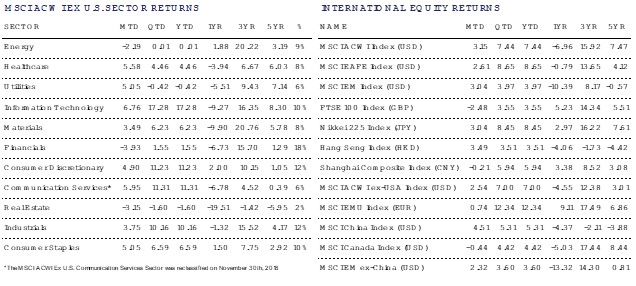
U.S. equities ended the month of March with gains, led by the benchmark S&P 500 Index which rose +3.7% on the month, after rallying +3.5% last week alone. For the quarter, the Large-Cap Index rose +7.5% to close at 4,109. Mid- and Small-Caps, as measured by the S&P 400 & 600 Indices were hard hit in the wake of the Silicon Valley Bank (SVB) fallout, losing -3.2% and -5.2%, respectively on the month. Both indices did manage to eke out gains for the quarter, with Mid- and Small-Caps gaining +3.8% and +2.5%, respectively. SMID-Cap indices are more heavily skewed towards Financials than their Large-Cap peers, which could be a headwind moving forward. Despite SVB’s collapse, market sentiment towards regional banks has rebounded somewhat with informal guarantees on deposits and diminished fears over a systemic banking crisis. Risks remain, however, as investors are still cautious on banks heavily exposed to areas like commercial real estate.
From a style perspective, Growth outperformed Value during the month and quarter as investors flocked back to Mega-Caps perceived as safe and high quality investments. Growth, as measured by the S&P 500 Growth Index gained +5.9% during the month, and +9.6% on the quarter, outperforming the broader S&P 500 Index.
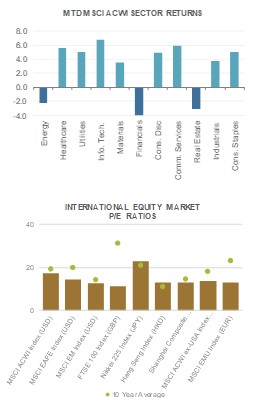
Sectors leading the charge included Technology, which gained +10.9% during the period, and +21.8% on the quarter, thanks to outsized rallies in stocks like Apple (+11.9%) and Microsoft (+15.6%) in March. The two Tech Mega-Caps now combine for nearly half of the Technology sector (46%) and more than 13% of the overall S&P 500 Index. Financials were the worst performer, losing -9.6% on the month, and -5.6% during the quarter. Other sectors in the red for March included Real Estate (-1.4%) and Materials (-1.0%). For the quarter, laggards include mostly Value oriented sectors such as Financials (-5.6%), Energy (-4.7%), Healthcare (-4.3%) and Utilities (-3.2%), many of 2022’s top performers.
Looking ahead, earnings season will kick off in two weeks with many of the top banks reporting earnings. Stay tuned.

International Equity
 International markets wrapped up a volatile, but positive first quarter of 2023 with most major indices in the black. Developed Markets (DM), as measured by the MSCI EAFE Index, returned +2.6% during the month of March and +8.7% over the first quarter. Emerging Markets (EM), as measured by the MSCI EM Index, notched a +3.0% gain during the month and +4.0% over the quarter.
As the US dealt with the Silicon Valley Bank and Signature Bank failures, constituents in Europe were dealing with their own banking crisis in Credit Suisse AG. The Swiss bank, which was one of the country’s oldest and largest financial institutions, announced that it had found “material weakness” in its 2021 and 2022 financial reporting process, leading to a major sell-off in its stock price. Aware of the potential economic fallout, the Swiss Central Bank offered to lend 50 Billion Swiss Francs ($54 billion USD) and ultimately acted as the broker arranging for rival UBS to purchase the bank for $3.2 Billion in an all-share transaction. As financial instability fears subsided during the back half of the month, European equities rallied causing the MSCI EMU Index to return +0.7% on the month (in Euros). Year-to-date, the index is up an impressive +12.3% (in Euros).
To the east, Chinese shares advanced as investors saw strong economic data paired with supportive comments out of Beijing around international policy. Li Qian, the country’s number 2 official, made comments at the ‘Boao Forum for Asia’ that reinforced China’s commitment to open its economy to international markets amidst challenges in the geopolitical environment. Economic data confirmed the optimistic outlook as China’s official Purchasing Managers Index rose to 51.9 and the non-manufacturing Purchasing Managers Index rose to 58.2 – both better-than-expected numbers. Readings above 50 indicates expansionary views from the previous month. The MSCI China Index gained +4.5% on the month (in USD).
It comes as no surprise that Financials were the weakest performer of all eleven MSCI ACWI Ex-U.S. sectors, falling -3.9%. Tech (+6.8%), Communication Services (+6.0%) and Healthcare (+5.6%) were the top performing sectors.
Fixed Income
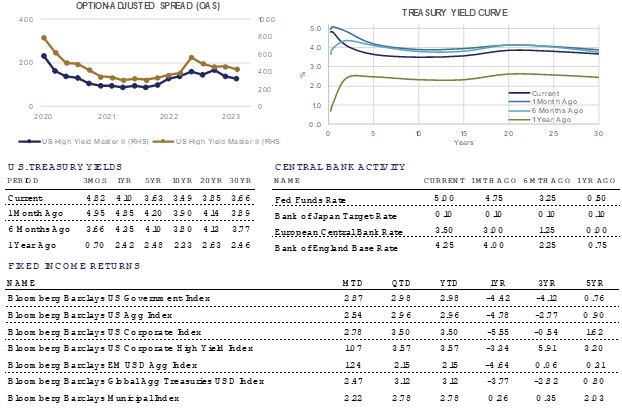
It was a volatile month in the interest rate markets as multiple banks were wound down/taken into receivership. This led to a bond market rally, as yields across the curve fell from 10 to 80 basis points in March. YTD, 1-6 month Treasury yields remain higher than in 2022, while all longer dated maturities now yield less than they did at the turn of the year.
Expectations for Federal Reserve interest rate hikes have waned, while prospects for interest rate cuts have grown. Worries about the impact of such an aggressive rate hike cycle are broadening, with a growing concern around the financial and real estate sectors. The Fed’s path is now less clear, as the choices they have to make become more difficult for certain sectors to bear. The Federal Reserve must weigh their continued battle with inflation against broader stability concerns.
The 3 month Treasury yield remains higher than the 10 year Treasury yield, meaning the curve is inverted. This inversion began in September of 2022. A sustained inversion of the curve (a minimum of 3 months) often precedes recessionary periods. This indicator has a strong track record of accuracy.
Credit spreads widened as uncertainty spread in the market, peaking around March 20th before tightening into month end. Investment grade spreads ended the month close to where they began the month. High Yield spreads finished March almost 50 bps wider than where they began, pushing HY bond prices lower and hurting their returns for the month. High Yield offered the lowest return in the month, while Investment grade largely kept pace with the Government bond index due to the spread tightening that was experienced going in to month end. Corporate bond issuance in the month was extremely light due to the market volatility.
There is significant relative and absolute value in long duration tax-free municipal bonds right now. The valuation spread between shorter maturity munis (paying roughly 60% of Treasury yields) and 30 year maturity muni bonds (paying close to 100% of Treasury yields or more) is historically wide, and likely to contract over time.
Alternative Investments
 Alternative investments were largely down on the month, with the lone exception being Gold, which benefitted from lower interest rates and a flight to quality during the Silicon Valley Bank (SVB) crisis this month. Gold rose +7.2% on the month and is now up nearly +8.0% for the year, clearly demonstrating its worth as a portfolio hedge to idiosyncratic risk, as well as a potential beneficiary from lower interest rates. It should also be noted that Gold has outperformed the broader S&P 500 since the October lows, and YTD. This bares watching moving forward.
Broad Commodities, as measured by the Bloomberg Commodities Index, fell -1.7% on the month, despite weakness in the US Dollar (-1.5%) and underscored by the -2.6% drop in West Texas Intermediate (WTI) crude oil. As we go to press, OPEC+ has announced a “voluntary” production cut of 1.1M barrels per day that has WTI prices hovering near $80/barrel this morning, representing a gain of more than +6% to start the month.
OPEC+ production cuts may be driven by many factors, including the fact the US is unlikely to refill the Strategic Petroleum Reserve (SPR) this year according to Energy Secretary Jennifer Granholm. Whether or not that was the root cause of production cuts remains unclear; however, it could simply be pre-empting the ongoing global economic slowdown. It was previously thought that the $67-72 range was a US SPR “put”, according to estimates previously mentioned by US government officials.
Currencies remain at a critical juncture. The Federal Reserve has slowed the pace of rate hikes and the market is currently pricing cuts by end of year. This contrasts with global central banks that continue to hike (i.e. ECB), resulting in a narrowing of interest rate differentials. This likely puts upward pressure on international currencies relative to the dollar moving forward.



Read more on ETFtrends.com.
The views and opinions expressed herein are the views and opinions of the author and do not necessarily reflect those of Nasdaq, Inc.


